Two nuclear clocks disclosed in June brought an unusual timekeeper into operation: a laser could be steered by a transition inside a thorium-229 nucleus. For the Chinese apparatus, public data posted on 13 September document a further gain: an optimized configuration has a fitted frequency-instability coefficient about four times smaller than the best configuration reported in June. Nature published the peer-reviewed account on 7 October. Neither date changes when nuclear-clock operation was first disclosed. [1–4,6]
From a resonance to a clock
An ordinary clock needs a recurring process and a way to count or compare it. In a precision optical clock, the reference is the frequency at which light excites a specific transition. Thorium-229 offers a rare nuclear transition within reach of laser light, at approximately 148.4 nanometres in this experiment. This wavelength lies in the vacuum ultraviolet (VUV), beyond visible light.
Finding the resonance is only part of the task. Imagine repeatedly asking whether the probe laser has moved above or below it. A small adjustment returns the probe towards the centre, then the measurement is repeated. This feedback process lets the nuclear response guide the laser. The analogy concerns frequency control; a nucleus does not physically swing like a pendulum.
The Chinese apparatus sends VUV light through thorium-doped calcium fluoride. Very small changes in transmitted light reveal nuclear absorption. Frequency modulation and a sensitive phototube turn that response into an error signal for the feedback loop. An optical cavity and frequency comb still supply a stable reference between interrogations. This is a laboratory system with specialist optics and radioactive material. [1,3]
A more stable configuration
The June Chinese preprint reported three configurations. Its best fitted coefficient was 2×10⁻¹² in the expression σy(τ)=a/τ/s, where τ is the averaging time. It already reported nuclear-clock operation and agreement between two crystals. [2]
The optimized fourth configuration uses the TS1 crystal and a phototube. Its fitted coefficient is 5×10⁻¹³. The authors increased detected VUV power to 350 nW, used an approximately 85% measurement duty cycle, reduced residual amplitude modulation and changed the modulation amplitude to 12 kHz. Several parameters changed together, so this comparison cannot separate their contributions. The September dataset already contains this optimized configuration; the October text explains it. [1,3,6]
Smaller frequency fluctuations make a weak signal easier to distinguish from noise. The gain does not establish a corresponding improvement in every property of the clock. Stability over one run, agreement between samples and absolute accuracy answer different questions.
Reading the performance number
The Allan deviation σy describes fractional frequency instability at a chosen averaging time. Fractional means that a frequency change is divided by the reference frequency. A smaller value indicates a more repeatable average frequency under the measurement conditions.
As a calculated illustration, substituting 100 s into the optimized fit gives 5×10⁻¹⁴; substituting 1000 s gives approximately 1.6×10⁻¹⁴. These are evaluations of the reported fitted relation, not additional measurements or estimates of accumulated time error. The relation should not be extended indefinitely beyond the observed interval.
The authors calculate instability from the frequency record inside the feedback loop. Their separately characterized optical reference supports that estimate, but an independent measurement outside the loop would check the complete output more directly. The uncertainty bars assume white frequency noise. Neither this comparison nor the older European demonstration establishes independent replication of the optimized configuration. [1,3]
Method and verification
The review compared the Chinese June v1, October v2 and accessible primary-source passages of the Nature paper, together with the September dataset. The European paper and June preprint provide context for the earlier milestone. Source texts and targeted methods were read; no experiment was performed for this article. [1–4,6]
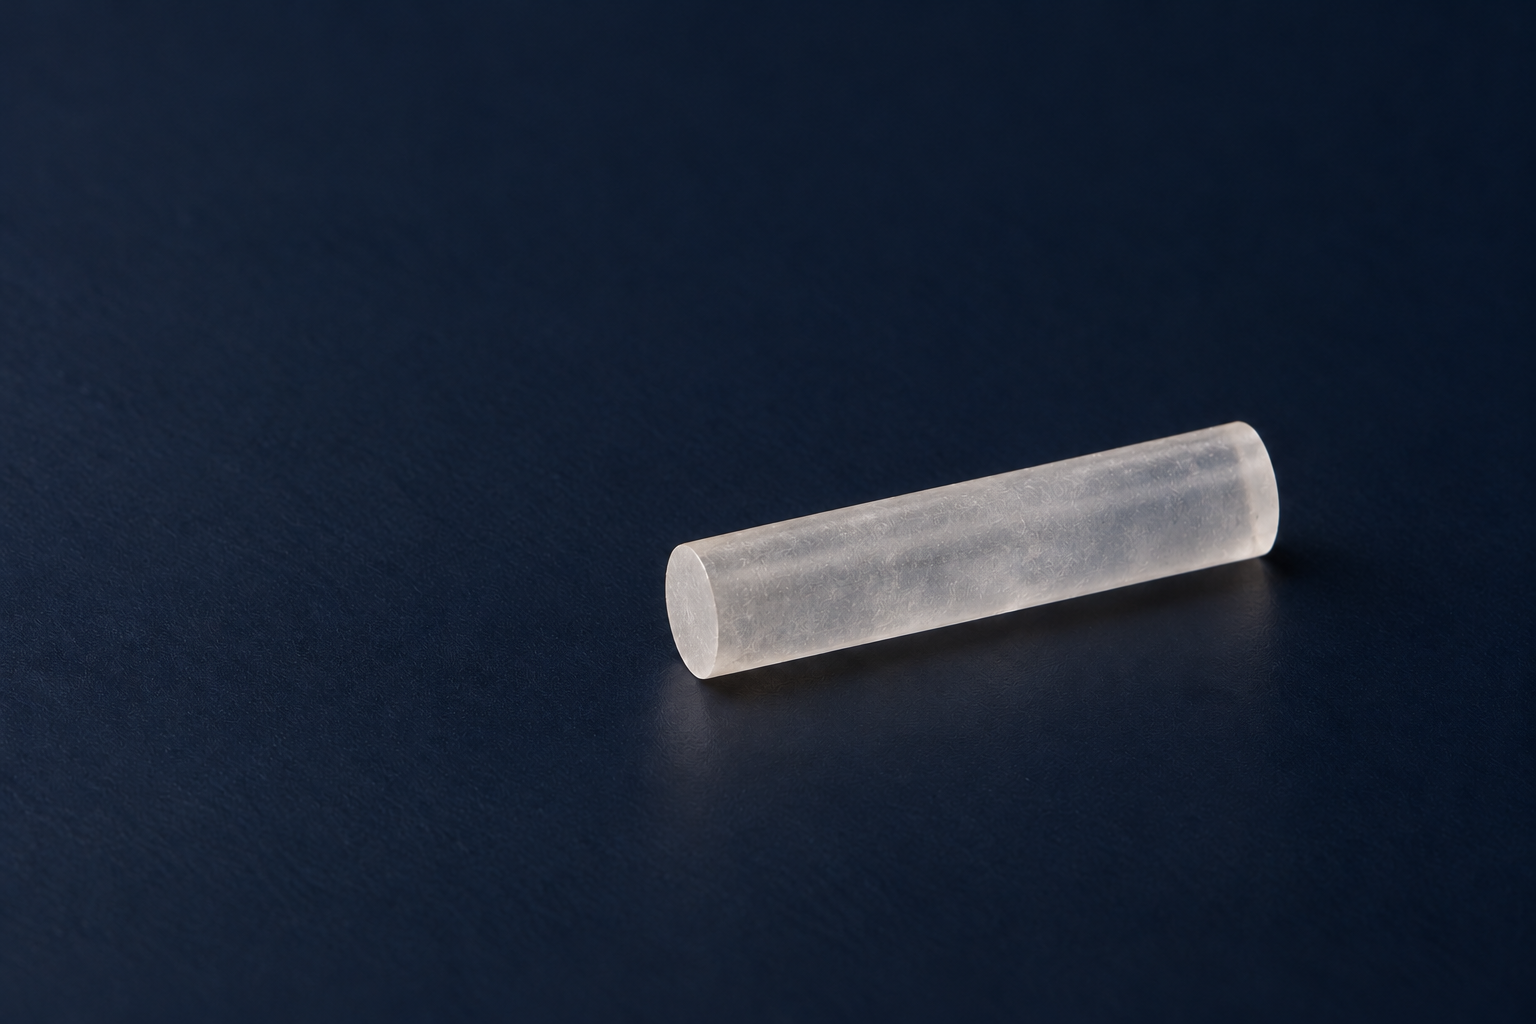
The optimized run used a 10.0-s measurement within an 11.8-s feedback cycle and a frequency record of approximately 13600 s. The b-line width was about 27 kHz. The cylindrical TS1 crystal measures 1.09 mm in diameter and 4.94 mm in length, with a reported thorium concentration of 2.2×1017cm−3. The temperature was 301.4(1) K. Temperature fluctuations and crystal-dependent shifts remain relevant limitations. The authors' photon-shot-noise estimate gives approximately 2.9×10⁻¹³, below the measured fitted 5×10⁻¹³; declining VUV power is one proposed contribution to the difference. [3]
The received Figshare v1 archive for Fig. 3 contains aggregated Allan-deviation values, 68.3% confidence bounds, fitting and plotting scripts, and stored outputs. The optimized dataset has 538 rows, extending to 6365.616 s; ten rows are marked for display. It does not contain the raw frequency series. The scripts fit a fixed exponent of −1/2, weighting log-space residuals using those confidence bounds. A separate arithmetic check on these aggregate values recovered coefficients of approximately 4.861×10⁻¹³ for the optimized configuration and 1.899×10⁻¹² for the preceding TS1 configuration, consistent with the stored fit parameters. [6]
That check did not execute the authors' code, recompute Allan deviation from raw data or reproduce the experiment. Reanalysis from the original measurements would require frequency samples, timestamps, noise assumptions and treatment of correlations. The last displayed point has broad asymmetric uncertainty. Files being available, read, executed and independently reproduced are distinct states.
The European dataset's Zenodo metadata were also read. They describe beat-frequency series and analysis outputs for that separate apparatus; its data files were not downloaded or reanalysed. [5]
Compact instruments and tests of fundamental physics remain research directions. Scarce thorium-229, specialist VUV generation, environmental control and the wider optical system remain constraints. Reproducing this experiment requires a qualified laboratory; this article provides a route to checking the result.
Editorial transparency: this article was prepared with AI assistance from identified primary sources. This review is neither independent peer review nor experimental replication. The cover is an AI-generated conceptual illustration of the documented cylindrical crystal; the invisible VUV beam is not depicted. It is not a photograph of the experiment.
Sources
- Huang et al., A nuclear clock synchronized to 229Th, Nature, 7 October 2026. Final paper.
- Huang et al., A nuclear clock based on 229Th, arXiv v1, 7 June 2026. Earlier version.
- Huang et al., A nuclear clock synchronized to 229Th, arXiv v2, submitted 7 October 2026. Revised text and methods.
- Toscani De Col et al., A thorium-229 optical nuclear clock with feedback loop. June v1; Nature, 7 October.
- Lahs, A thorium-229 optical nuclear clock with feedback loop, dataset v1, 8 September 2026. Zenodo record.
- Huang et al., Data supporting “A nuclear clock synchronized to ²²⁹Th”, Figshare v1, public 13 September 2026. Versioned dataset.