Correction — 2026-09-09 — The table now gives approximately 64.05 h for ground-state 90Y, replacing 3.19 h, which belongs to metastable 90mY. This corrects the nuclear-state identification; it does not establish that the study’s simulations used the erroneous printed value. The modelled core/pool split, experimental limits and uncertainty assumptions have been clarified.
AI-assisted correction and translation of the correction, with targeted source and consistency checks; the original article’s authorship is unchanged.
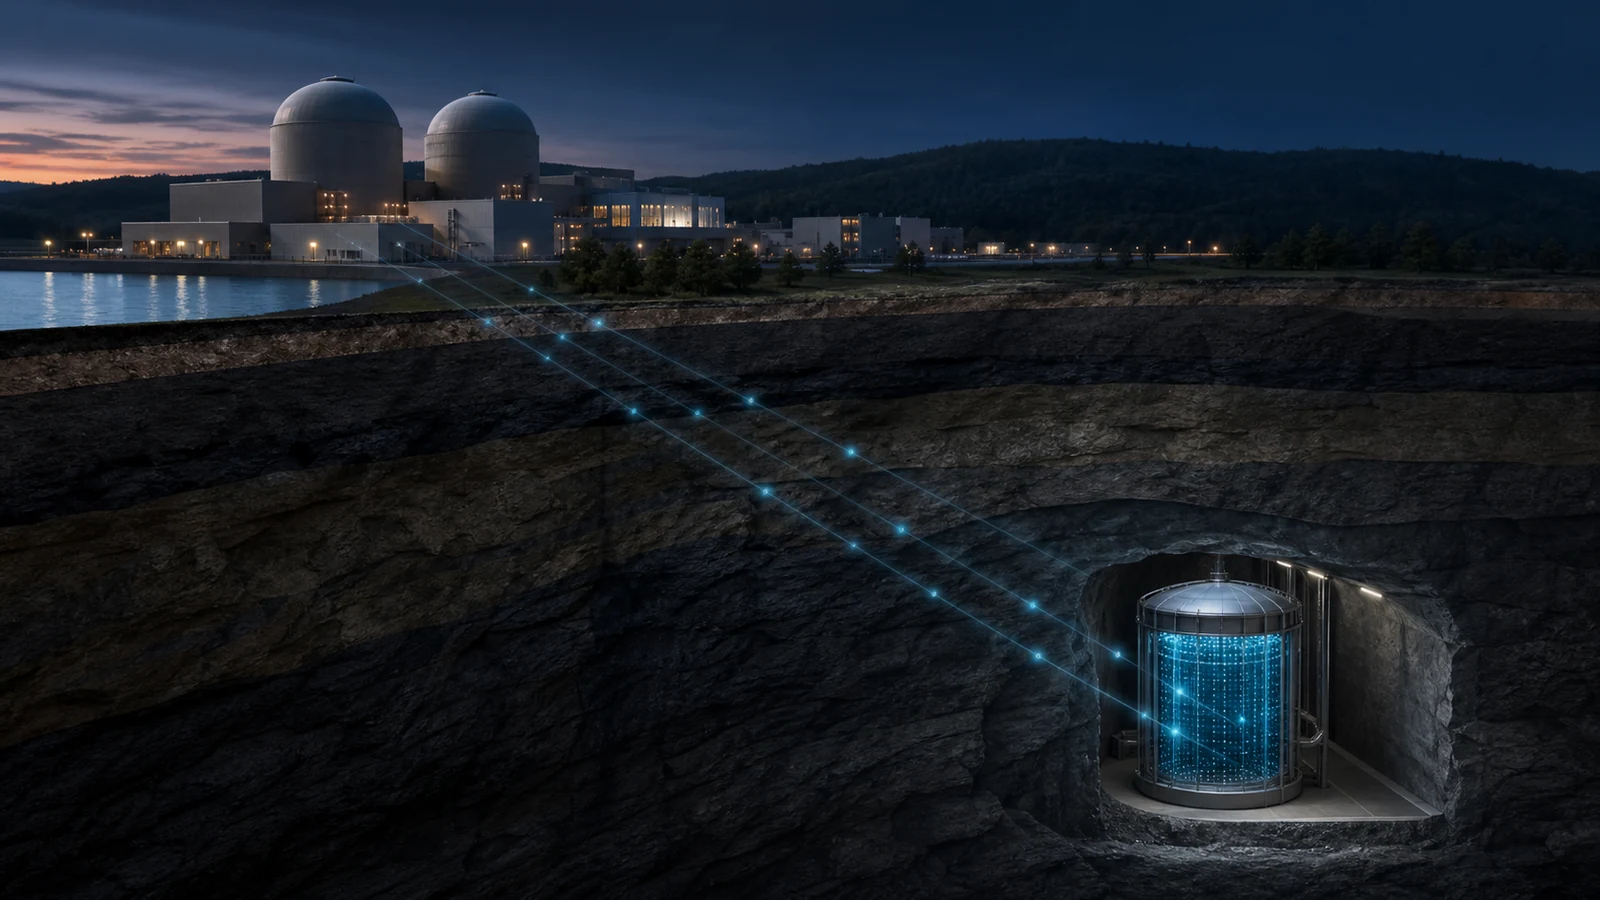
A shut-down nuclear reactor is not silent. Fission products accumulated in its core and pools continue to decay for months or years, and their beta-decay chains emit antineutrinos. The Double Chooz collaboration is publishing the first quantitative measurement of this residual flux, obtained during simultaneous shutdowns of both reactors at the Chooz nuclear power plant.
Source: journals.aps.org
In plain language
When a wood fire is put out, its embers continue to glow for a long time. A nuclear reactor does the same thing, but with a glow that no eye can see: a flux of ghostly particles—antineutrinos—produced by the beta-decay chains of fission products in irradiated fuel remaining in the cores and in spent assemblies stored in pools.
Over 17.2 live days during which both Chooz reactors, in the French Ardennes, were shut down, the near detector—located about 400 metres from the cores and shielded by 115 metres water equivalent—isolated 106 ± 18 residual candidates after background subtraction. That is roughly six per day. The detailed model predicts that 44% of the signal comes from the pools where spent fuel cools; the detector does not directly separate this share.
The prospective practical application is nuclear-materials safeguards: antineutrinos pass through matter with a very low interaction probability, making it possible to observe a reactor without accessing its core. A caveat, however: this result relies on several tens of cubic metres of scintillator and 115 metres water equivalent of underground shielding. It validates a residual-flux calculation; it does not demonstrate that a portable device would work at the surface of a nuclear power plant.
| Parameter | Value |
|---|---|
| Sources | Physical Review Letters, vol. 137, art. 061803, August 4, 2026 — peer-reviewed article; preprint arXiv:2510.04869 |
| Collaboration | Double Chooz — international collaboration |
| Site | Chooz nuclear power plant (Ardennes, France), two pressurised-water reactors |
| Near detector | 400 m from the cores, beneath 115 m water equivalent; target: 10.3 m³ of gadolinium-doped liquid scintillator + 22.6 m³ “gamma catcher”; 390 10-inch photomultipliers |
| Observation window | 4 simultaneous shutdowns of both cores in 2017; total reported at source: 24.4 days; rounded individual durations: 1.6 · 1.1 · 1.0 · 20.8 days; 17.2 live days at the near detector |
| Key result | 106±18 residual candidates after background subtraction between 1 and 3 MeV, or 6.2±1.1 events/day; incompatibility with background alone at 5.9σ; model: 88±7, hence Δ=18±19 |
| Far detector | 1.05 km: 27±13 after background subtraction versus 14±1 predicted, or 1.2±0.6 events/day |
| Predicted source split | 56% reactor cores · 44% spent-fuel storage pools |
| Normalisation uncertainty | 7.4% in total, dominated by 6.0% from spectral modelling (nuclear structure of 144Pr) |
| Precedent | A 2011–2012 analysis had collected only about twenty candidates—not enough to extract a spectrum |
Technical explanation
1. How an antineutrino is caught, and why so many are needed.
The reaction used is inverse beta decay (IBD): νˉe+p→e++n. An electron antineutrino interacts with a free proton—an atomic hydrogen nucleus in the scintillator—and produces a neutron and a positron. The signature has two parts, and that is what makes the measurement possible despite a rate of only a few events per day. The positron immediately deposits its kinetic energy and then annihilates: this is the prompt signal. The neutron scatters before being captured; Double Chooz's “total neutron capture” method uses captures on gadolinium, hydrogen and carbon in the inner volumes to form the delayed signal. Requiring both signals within a window of 0.5 to 800 µs and less than 1.2 m apart eliminates most ambient radioactivity. The antineutrino energy is reconstructed from the prompt signal through Eνˉe≃Eprompt+0.78 MeV, and the reaction has a kinematic threshold of about 1.8 MeV: below that threshold, this channel does not detect the antineutrino.
2. Where the residual glow comes from: three chains, three clocks.
When a reactor is operating, most of its antineutrino flux comes from short-lived fission products, whose contribution collapses in the hours after shutdown. The detectable remainder comes mainly from three parent–daughter pairs: during irradiation and then cooling, a long-lived parent continually feeds a much shorter-lived daughter. Because the daughter disappears rapidly after each production event, its activity mainly tracks that of the parent; shutdown primarily removes the dominant flux that masked these persistent chains.
| Pair | Parent half-life | Daughter: half-life and maximum energy Qβ | Role |
|---|---|---|---|
| 144Ce→144Pr | 285 days | 17.3 min · 3.00 MeV | ≈ 54% of the 1–3 MeV signal expected by the model |
| 106Ru→106Rh | 372 days | 30.1 s · 3.54 MeV | ≈ 38% of the signal expected by the model |
| 90Sr→90Y | 28.9 years | 64.05 h · 2.28 MeV | becomes dominant in the model prediction over the long term (> 90% after a decade) |
These energies govern everything that follows: with Qβ values of 2 to 3.5 MeV and an IBD threshold of 1.8 MeV, only the high-energy tail of each beta spectrum can be detected. The authors consequently expect 98.7% of the detectable residual flux below 3 MeV—which justifies restricting the analysis to the 1–3 MeV prompt-energy window and also makes it difficult: that is where backgrounds are densest.
3. What the 1–3 MeV window measures exactly, and the control that validates it.
Restricting the analysis to a window where the signal is expected invites a classic objection: one finds what one is looking for where one has chosen to look. The authors address it with a negative control. Above 3 MeV, the yields after background subtraction are compatible with zero. The model does predict a small residual tail, but below 0.1 event per day and therefore beneath current sensitivity. The absence of a measurable excess in this region supports the background model; it does not prove that the physical flux there is strictly zero.
4. The backgrounds, and why underground shielding matters.
At six events per day, everything counts. Three families are treated separately. Accidentals—two unrelated energy deposits, one mistaken for a prompt signal and the other for a delayed signal—are suppressed by a neural network whose rejection power exceeds 400; what remains is then measured in situ from the rate of isolated deposits. Correlated backgrounds come from cosmic muons: either fast neutrons produced by spallation in the rock, which mimic a prompt signal before being captured, or β-n isotopes such as 9Li, produced by muon spallation on the scintillator's 12C, whose decay supplies the electron–neutron pair by itself. The latter are tagged by their temporal and spatial correlation with the parent muon. The near detector's 115 m water-equivalent shielding reduces the muon flux and thus the production of these isotopes, which no veto can eliminate perfectly.
5. The prediction: an inventory calculation, assembly by assembly.
The expected count is not an order-of-magnitude estimate but a detailed simulation. The predicted IBD spectrum is written
dEvisdNνˉe=i∑4πLi2Np∬φi(E,t)σIBD(E)Pee(E,Li)D(Evis∣E)dEdt,
6. Why the model attributes 44% to the pools.
The two storage pools are close to the cores—so from a detector about 400 m away, their geometric 1/L2 factor remains comparable. Each assembly arrives there after several irradiation cycles and cools there for years. A shut-down core contains a recent inventory that decays quickly; a pool accumulates assemblies of staggered ages, some of whose isotopes persist for a long time. During a prolonged shutdown, the sum of the predicted contributions from the pools becomes comparable to that from the cores. The integrated calculation gives 56% for the cores and 44% for the pools; these two fractions were not independently measured in this analysis.
7. What limits the prediction, and what this precludes us from concluding.
The normalisation uncertainty on the predicted count reaches 7.4%, broken down into 6.0% for spectral modelling, 2.9% for baseline geometry, 2.1% for the fission-product inventory, 2.0% for the inventory of assemblies in the pools and less than 0.8% for the detector. The dominant term comes from the shape of the 144Pr beta transition, whose uncertainty is taken to be the difference between a detailed nuclear-structure calculation and the so-called ξ approximation. These 7.4% measure neither the precision of the data–model agreement nor the performance of inventory inference: this study compares a count with a prediction, without inversely estimating a fuel mass or composition.
Diagram notation: Nobs is the measured residual count, Npred the model prediction and H0(B) the background-only hypothesis. The 5.9σ compare Nobs with H0(B), not with Npred.
Schematic, not to scale. N_obs denotes the observed count; N_pred the prediction. B1/B2 are the cores, P1/P2 the pools; the 56%/44% split is predicted.
Why it worked
The measurement depends on both a circumstance and a geometry. The circumstance: in 2017, the two Chooz reactors were simultaneously shut down four times, including one period lasting 20.8 days—an essential condition, because the near detector records about 900 IBD events per day at full power, compared with 6.2 ± 1.1 residual events per day here. The geometry: an already-built, calibrated and well-understood detector, installed 400 m away, whose systematic effects had been established by years of oscillation measurements.
The numerical comparison is direct. An earlier analysis, based on 2011–2012 data, had collected only about twenty candidates—too few to extract a residual spectrum. Here, after background subtraction, 106 ± 18 residual candidates are compared with 88 ± 7 expected: the difference is Δ=18±19 events, meaning agreement. At the far detector, the result is 27 ± 13 versus 14 ± 1 expected, with an error bar that makes the conclusion far less restrictive.
The limitations are explicit. The signal analysis covers the 1–3 MeV window. Above 3 MeV, the subtracted yields are compatible with zero, while the model retains a small residual tail extending to around 4.5 MeV, below 0.1 event per day and unresolved in this sample. The 7.4% normalisation uncertainty characterises the prediction; the experiment does not demonstrate the precision of inventory inference.
The gap between what is demonstrated and what is envisaged deserves to be stated. What is demonstrated: a residual flux is distinguished from background at 5.9σ, and the count 106±18 is compatible with the prediction 88±7 because Δ=18±19. What is not demonstrated: operational fuel monitoring. The demonstration uses more than 30 m³ of scintillator beneath 115 m water equivalent, for roughly six events per day at 400 m. A compact surface instrument would still have to control cosmic background and demonstrate sensitivity to changes in inventory.
Causal chain
Fission in the core → accumulation during irradiation of long-lived parents (144Ce, 106Ru, 90Sr) feeding short-lived beta daughters → reactor shutdown and rapid disappearance of the dominant flux → persistence of the chains already established in the cores and in assemblies transferred to the pools → four simultaneous shutdowns totalling 24.4 days in 2017 → 17.2 live days at the near detector → 106±18 residual candidates between 1 and 3 MeV, incompatible with background alone at 5.9σ → small predicted tail above 3 MeV, below 0.1 event per day and unresolved → compatibility with the assembly-by-assembly model (88±7, Δ=18±19) → first quantitative benchmark for testing residual-flux calculations → future studies separating core and pool contributions and using dedicated detectors.
An anecdote
Double Chooz had already attempted this measurement with its 2011–2012 data. At the time, the collaboration had collected only about twenty residual candidates: the near detector was not yet available, and the simultaneous shutdown time was too short to extract a spectrum. In 2017, the near detector was operating and four simultaneous shutdowns, including one lasting 20.8 days, provided 17.2 live days; those two changes made the quantitative measurement possible.
Legacy and current evidence
The measurement provides the first published quantitative comparison between a summation calculation of residual flux and an actual count. The prediction has a 7.4% normalisation uncertainty; the observed comparison is Δ=18±19 events. These two quantities must not be confused.
The paper discusses possible safeguards applications, but does not demonstrate a compact surface detector or inventory reconstruction.
The researcher's view — open questions
These are possible extensions, not results of the study.
- The decisive spectral test. With more statistics, tracking the relative evolution of 144Ce and 106Ru over several months would test the model's time dependence. Observing dominance by the 90Sr–90Y pair would take years: the prediction exceeds 90% only after more than ten years.
- The 56%/44% split is a model prediction, not an independently measured separation of cores and pools. The distances of 400 m and 38 m alone do not establish an impossibility of separation. A different detector arrangement would require a sensitivity study including response, backgrounds and statistics.
- The nuclear-structure bottleneck. The dominant uncertainty comes not from the detector but from the shape of the 144Pr beta transition. A dedicated measurement of this beta spectrum could reduce the 6.0% term, but the study does not quantify the ultimate precision the model would then attain.
Sources
Sources examined on September 9, 2026: published paper and preprint v1 (October 6, 2025).
- Double Chooz Collaboration, “First Measurement of Neutrino Emissions from Spent Nuclear Fuel by the Double Chooz Experiment”, Physical Review Letters 137, 061803, August 4, 2026 — peer-reviewed article. DOI: 10.1103/dr26-j19g
- Preprint version of the same work: arXiv:2510.04869 — full text consulted (abstract, methods, systematic-uncertainty tables).
Background references
- P. Vogel and J. F. Beacom — Angular distribution of neutron inverse beta decay — reference kinematics and cross-section for inverse beta decay.
Confidence statement
The published counts and model predictions have been compared with the primary paper. The underlying data are not publicly available; the raw-data analysis and simulations have not been reproduced here. Independent replication has not been established by this audit. Scientific and translation review here is performed by AI, without independent human validation.
Calculation note: Δ = 106 − 88 = 18 events. Assuming uncorrelated quoted errors, σΔ = √(18² + 7²) ≈ 19.3 events. This approximate compatibility check is distinct from the paper’s 5.9σ signal significance. Daughter activity follows the long-lived parent approximately only after the transient, under the decay-chain equilibrium approximation.
News editorial method — this correction
This correction compares the reported counts and predictions with the primary paper and checks the nuclear half-life against evaluated ENSDF data. The simple uncertainty calculation is reproduced with its assumption stated. The English revision and seven translations are checked for numerical, scientific and linguistic consistency; diagram coordinates and mathematical rendering are checked separately. These are AI-assisted editorial checks, not independent human review or a reproduction of the experiment. The original attribution is retained. A dated note identifies the substantive changes; the previous revision is retained for traceability. Unresolved claims remain qualified.