1. Objectives and prerequisites
Prerequisite: evaluate a function and read two points from its graph. You will learn to calculate a rate of change, interpret it as a secant slope, keep track of units, and compare intervals.
2. Definition: output change per input change
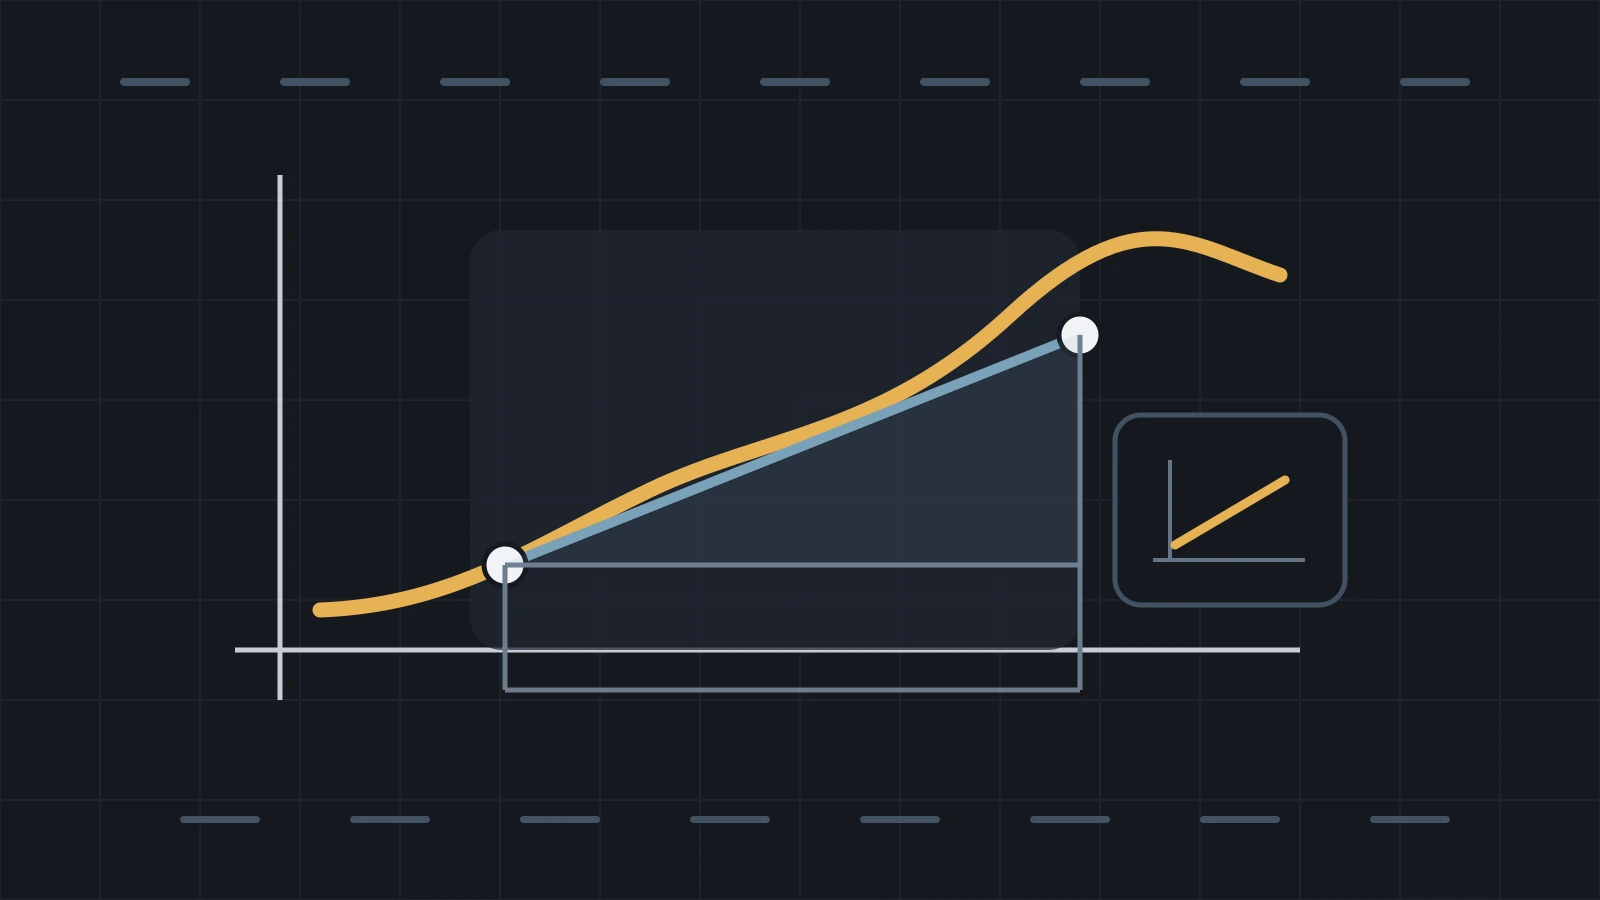
For two distinct inputs a and b, the rate of change of f from a to b is (f(b)-f(a))/(b-a). The numerator Δy=f(b)-f(a) is the output change; the denominator Δx=b-a is the input change. We require b≠a to avoid division by zero.
3. Geometric meaning: secant slope
Points A=(a,f(a)) and B=(b,f(b)) lie on the graph. The line through A and B is a secant. Its slope is exactly Δy/Δx, the rate of change. A positive rate gives an upward secant, a negative rate a downward secant, and zero a horizontal secant.
4. Units and representations
The units are output units divided by input units: km/h, °C/h, €/unit, and so on. The rate can be calculated from a formula or a table and estimated from a graph by reading two points. Graph readings may be rounded, so they can be less precise than calculations from exact values.
5. Worked example
For f(x)=x² from 1 to 3, f(1)=1 and f(3)=9. Thus Δy=8, Δx=2, and the rate of change is 8/2=4. Geometrically, the secant through (1,1) and (3,9) has slope 4.
6. Practice
6.1. Calculate with a square function
For f(x)=x², calculate the rate of change from x=1 to x=4. Show f(1), f(4), Δx, Δy, and then the quotient Δy/Δx.
Guided correction. f(1)=1 and f(4)=16; Δy=15 and Δx=3; the rate is 5.
6.2. Compare a temperature change
A temperature is 12 °C at 8:00, 18 °C at 11:00, and 20 °C at 15:00. Calculate the average rate of change over 8:00–11:00 and 11:00–15:00 in °C/h. Compare the intervals and explain why the averages do not prove that temperature changed at a constant rate.
Success criteria. Both quotients use the correct elapsed times, units are explicit, and the conclusion distinguishes an interval average from instantaneous change.
6.3. Compare two intervals without copying a formula
For g(x)=x²+1, calculate the rate of change on [-1,2] and on [2,3]. Compare the results and use the two secant lines to explain what the difference says about how g changes.
Success criteria. The justification rebuilds both quotients from g-values, compares the average slopes correctly, and does not call them derivatives.
7. Going deeper: the interval changes the answer
7.1. One function, several rates
Rate of change depends on the two chosen endpoints. For f(x)=x², the rate on [0,1] is 1, while on [1,2] it is 3. On [-1,1] it is 0 even though the function is not constant inside that interval. An average rate therefore summarizes what happened between endpoints; it does not describe every intermediate moment.
Comparing several intervals is useful precisely because the values can differ. It can reveal acceleration, slowing, or a change of direction without yet invoking a derivative.
7.2. Absolute rate, percentage, and units
A quotient Δy/Δx is not automatically a percentage. An increase of €20 over 4 days is 5 €/day. A percentage answers a different question because it compares a change with a reference value. Mixing the two can produce a plausible number with the wrong meaning.
Units are part of the result. They distinguish 5 km/h from 5 °C/h or 5 €/unit. Changing the input unit also changes the numerical value: 60 km/h is the same physical rate as 1 km/min.
7.3. Formula, table, and graph have different precision
A formula with exact values can yield an exact quotient. A table inherits measurement precision. A graph usually requires reading approximate coordinates, so its slope should be reported as an estimate. If the two points are hard to locate precisely, the relative uncertainty of the quotient can become large.
When comparing rates, keep intervals and sign conventions consistent. Reversing both endpoints changes the signs of Δx and Δy together and leaves the quotient unchanged; changing only one sign creates an error.
7.4. Common mistakes and boundaries
Common mistakes include forgetting to divide by input change, allowing b-a=0, dropping units, confusing average rate with total change or percentage change, reading a tangent slope when the question gives two points, or claiming that a zero average rate means nothing changed inside the interval.
Rate of change answers one precise question: how much output changes on average per unit of input between two stated endpoints. A derivative will later answer a local question by shrinking that interval toward a point.
8. Summary
A rate of change is a quotient of changes: Δy/Δx. It describes average change between two distinct inputs, equals the slope of the corresponding secant line, and carries meaningful units.
9. Curriculum sources
- French Ministry of Education — 2026 mathematics specialty curriculum for Première générale, annex p. 360, “Dérivation”: official bulletin.
- California Department of Education — F-IF.6, calculate and interpret average rate of change: California Content Standards.
10. Revision note
Lesson prepared on 25 September 2026 from two official references from different countries. Numerical examples were recomputed; text and translations were prepared with AI. No measured learning gain is claimed.